Drayage Savings Calculator

Drayage Savings Calculator

Costs are at record highs. Profit Driver puts money back on your bottom line.

Costs are at record highs. Profit Driver puts money back on your bottom line.

Costs are at record highs. Profit Driver puts money back on your bottom line.

See your projected annual savings across insurance, factoring, and safety & compliance: plus the revenue you're leaking today. Built for drayage carriers running 3-25 trucks.

See your projected annual savings across insurance, factoring, and safety & compliance: plus the revenue you're leaking today. Built for drayage carriers running 3-25 trucks.

Quick calculator

Driver Planner & Itinerary

Calculate your savings

Calculate your savings

Calculate your savings

Adjust the fields on the left, your results update instantly.

Adjust the fields on the left, your results update instantly.

Your business today
Only your numbers are editable — PortPro rates are fixed.
Fleet & Revenue
#
$
Total annual revenue:$3,750,000
Insurance
benchmark applied
%
Small drayage carriers typically run 4%–7% of revenue.
Benchmarked against PortPro's
pooled insurance program
Factoring
rate auto-applied
#
$
$3,750,000projected annual factored volume
Safety management & compliance
50% reduction
$
DOT compliance, safety management, ELD, drug & alcohol, filings.
Revenue leakage
2% recapture
Industry revenue leakage runs 3%–5% of revenue (missed accessorials, chassis, detention). Profit Driver conservatively recaptures 2% of your annual revenue.
Your projected annual savings
With PortPro Profit Driver
Total annual impact
$207,125
$13,808 per truck / year
Insurance savings
$3,750/truck
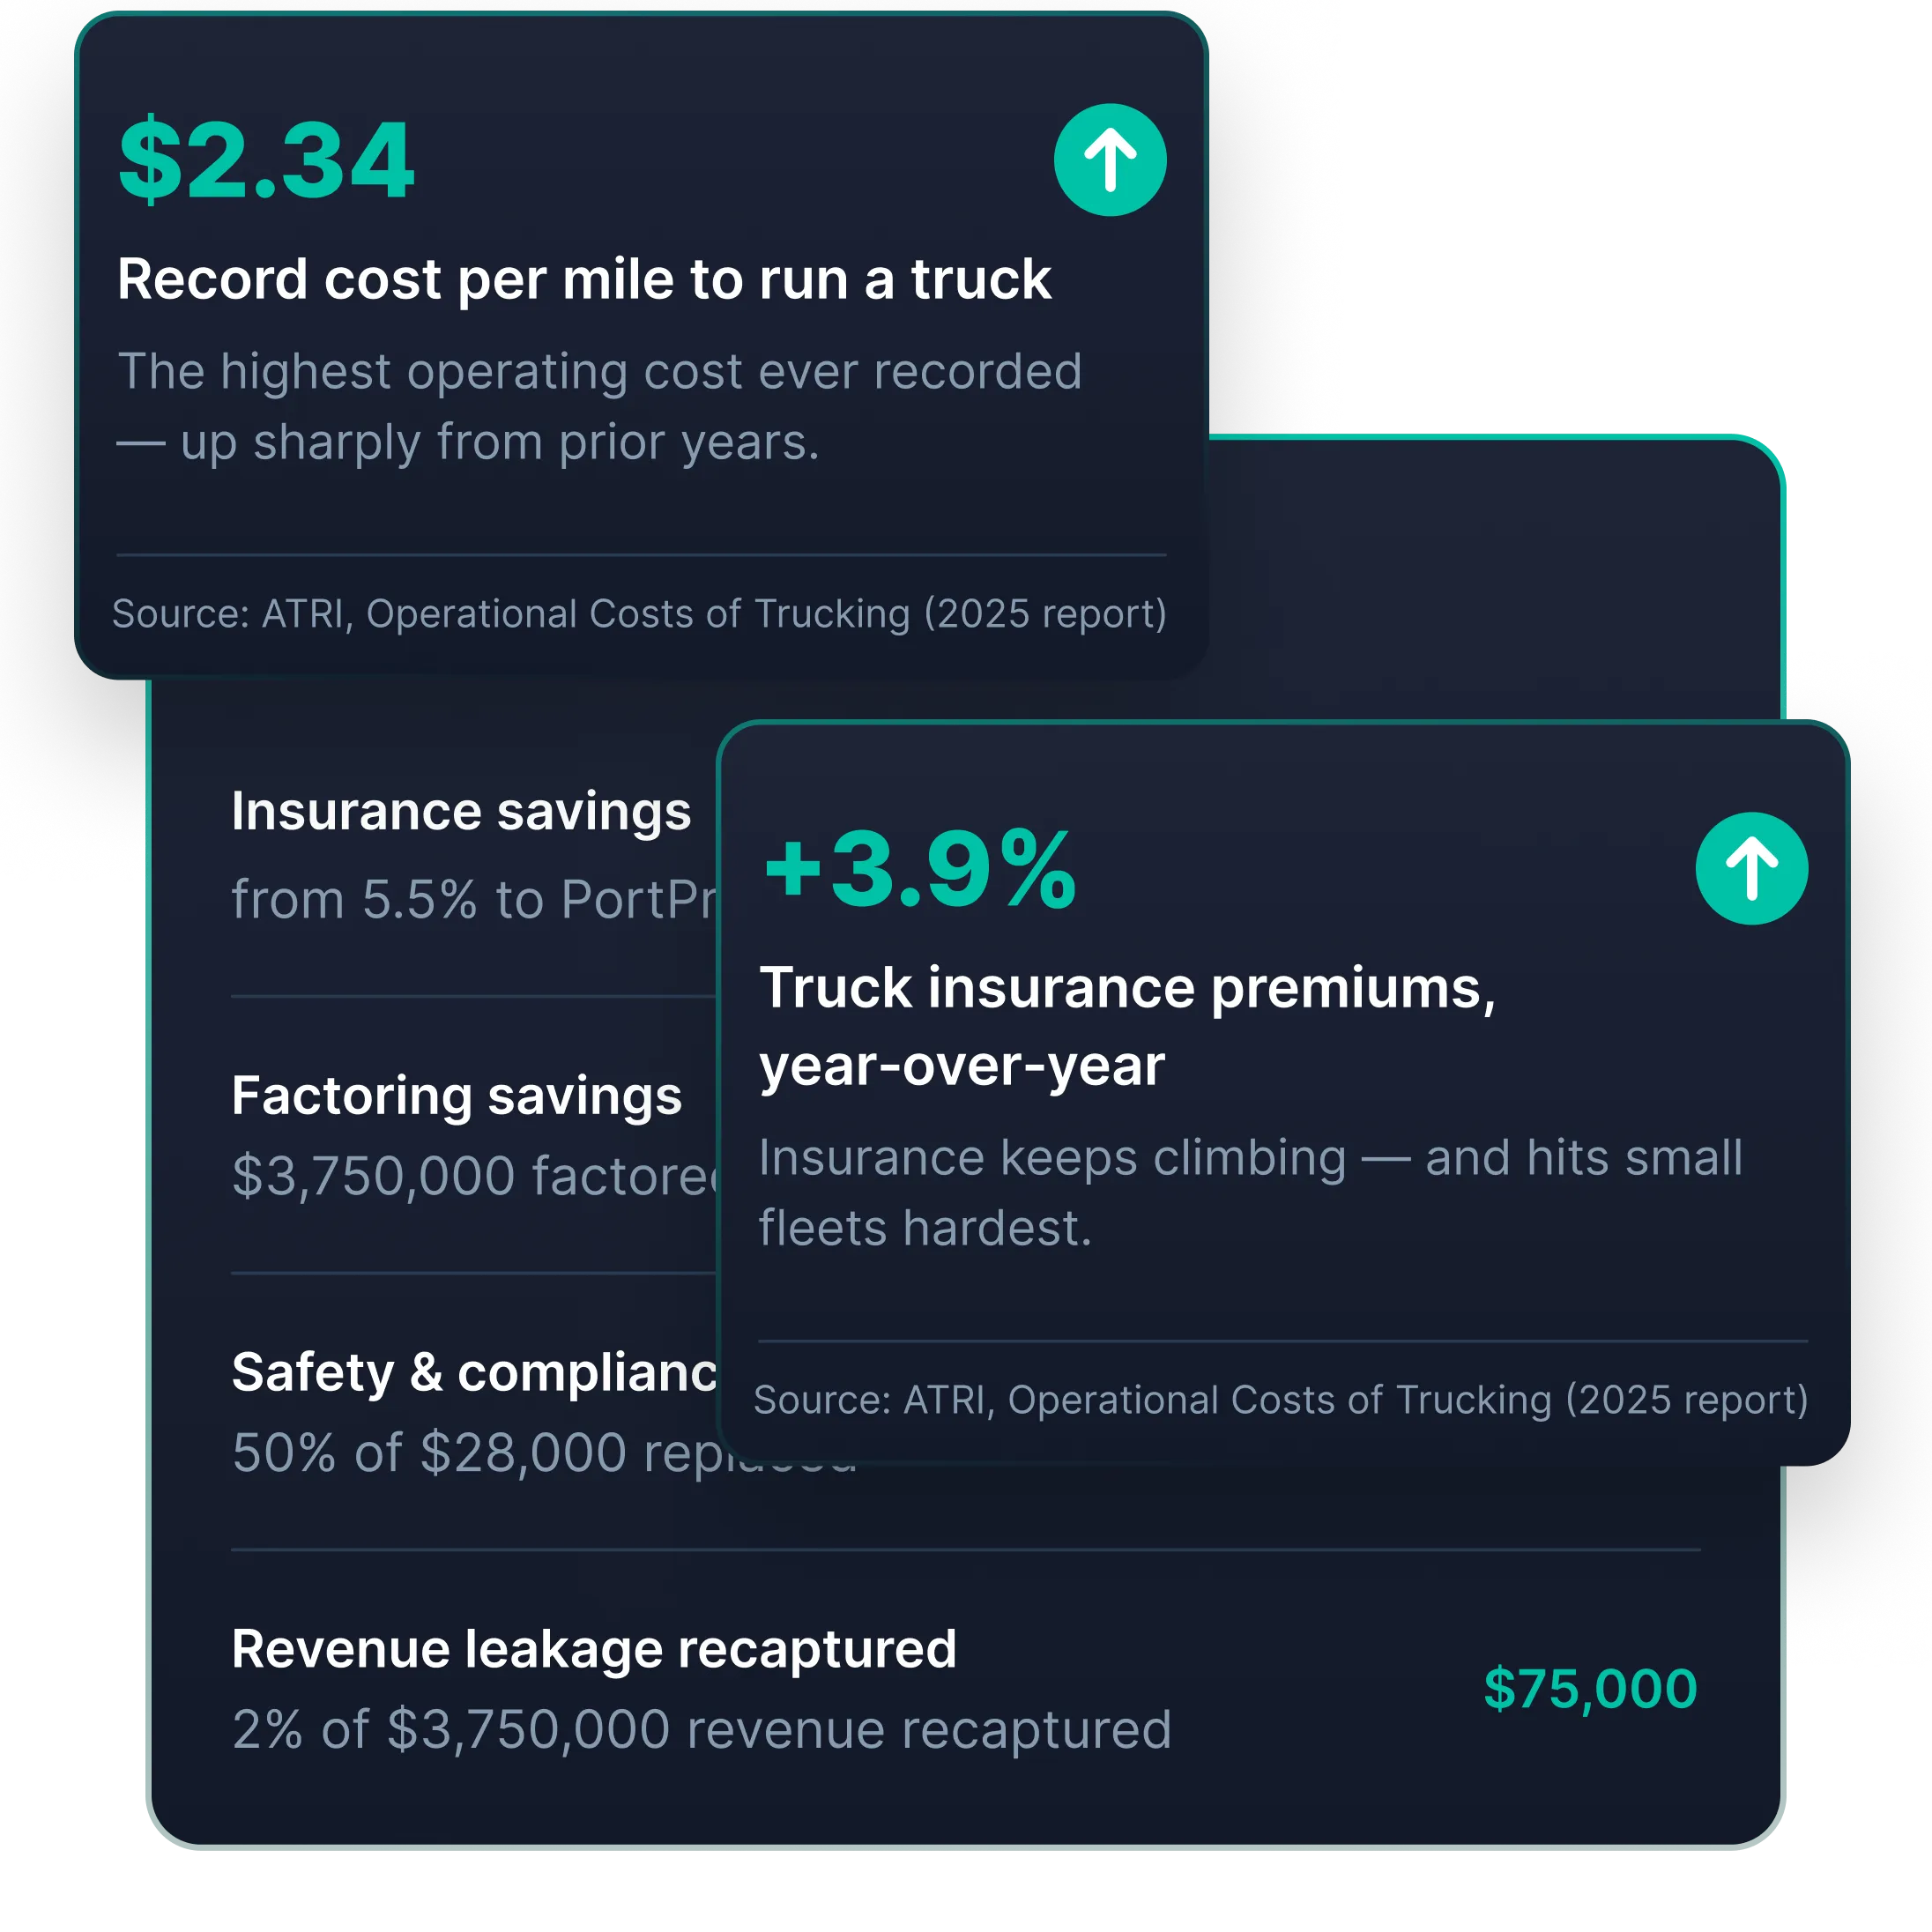
from 5.5% to PortPro pooled benchmark
$56,250
Factoring savings
$3,750,000 factored / yr
$61,875
1.65% below your current rate
Safety & compliance
50% of $28,000 replaced
$14,000
Revenue leakage recaptured
2% of $3,750,000 revenue recaptured
$75,000
Let's walk through your numbers

These numbers are estimates based on industry benchmarks. Book a Drayage Savings Assessment and we'll confirm your real numbers, and show you exactly how Profit Driver gets you there.

Estimate only. Final rates depend on loss history, authority & volume.

How these numbers work. Insurance savings compare your current premium (as a % of revenue) to PortPro's pooled-book benchmark. Factoring savings compare your current rate to the PortPro rate for your monthly volume tier. Safety & compliance assumes a 50% reduction in current all-in spend. Revenue-leakage recapture applies a conservative 2% of annual revenue. All figures are directional estimates; final rates depend on loss history, authority, and volume.


Market statistics. Record operating cost of $2.34 per mile and a 3.9% year-over-year increase in insurance premiums are from the American Transportation Research Institute (ATRI), "An Analysis of the Operational Costs of Trucking" (2025 report).